The Bakery Story: when PE ratio and Gordon are misled
Let’s take a fictional example to show that relying on the PE ratio and Gordon’s formula can violate basic principles, that Modigliani carved in marble.
In an imaginary city of baguette-loving inhabitants, there is a famous chain of bakeries, each changing hands almost every new year.
Each bakery generates 100 K€ per year, after paying the manager and all expenses. There is no growth, no inflation. The shareholders can pay themselves an annual dividend equal to the profit of 100 K€ and go back on holiday.
Transaction 1: The initial purchase and resell
A first owner buys a bakery for 1000 K€. Gordon’s formula gives the Cost of Equity:
For once, this 10% equals Earnings/Price: with no growth, all earnings are distributed as dividends, so the Cost of Equity equals both the Dividend Yield and the Earnings / Price ratio (the inverse of the PE, known as the Earnings Yield).
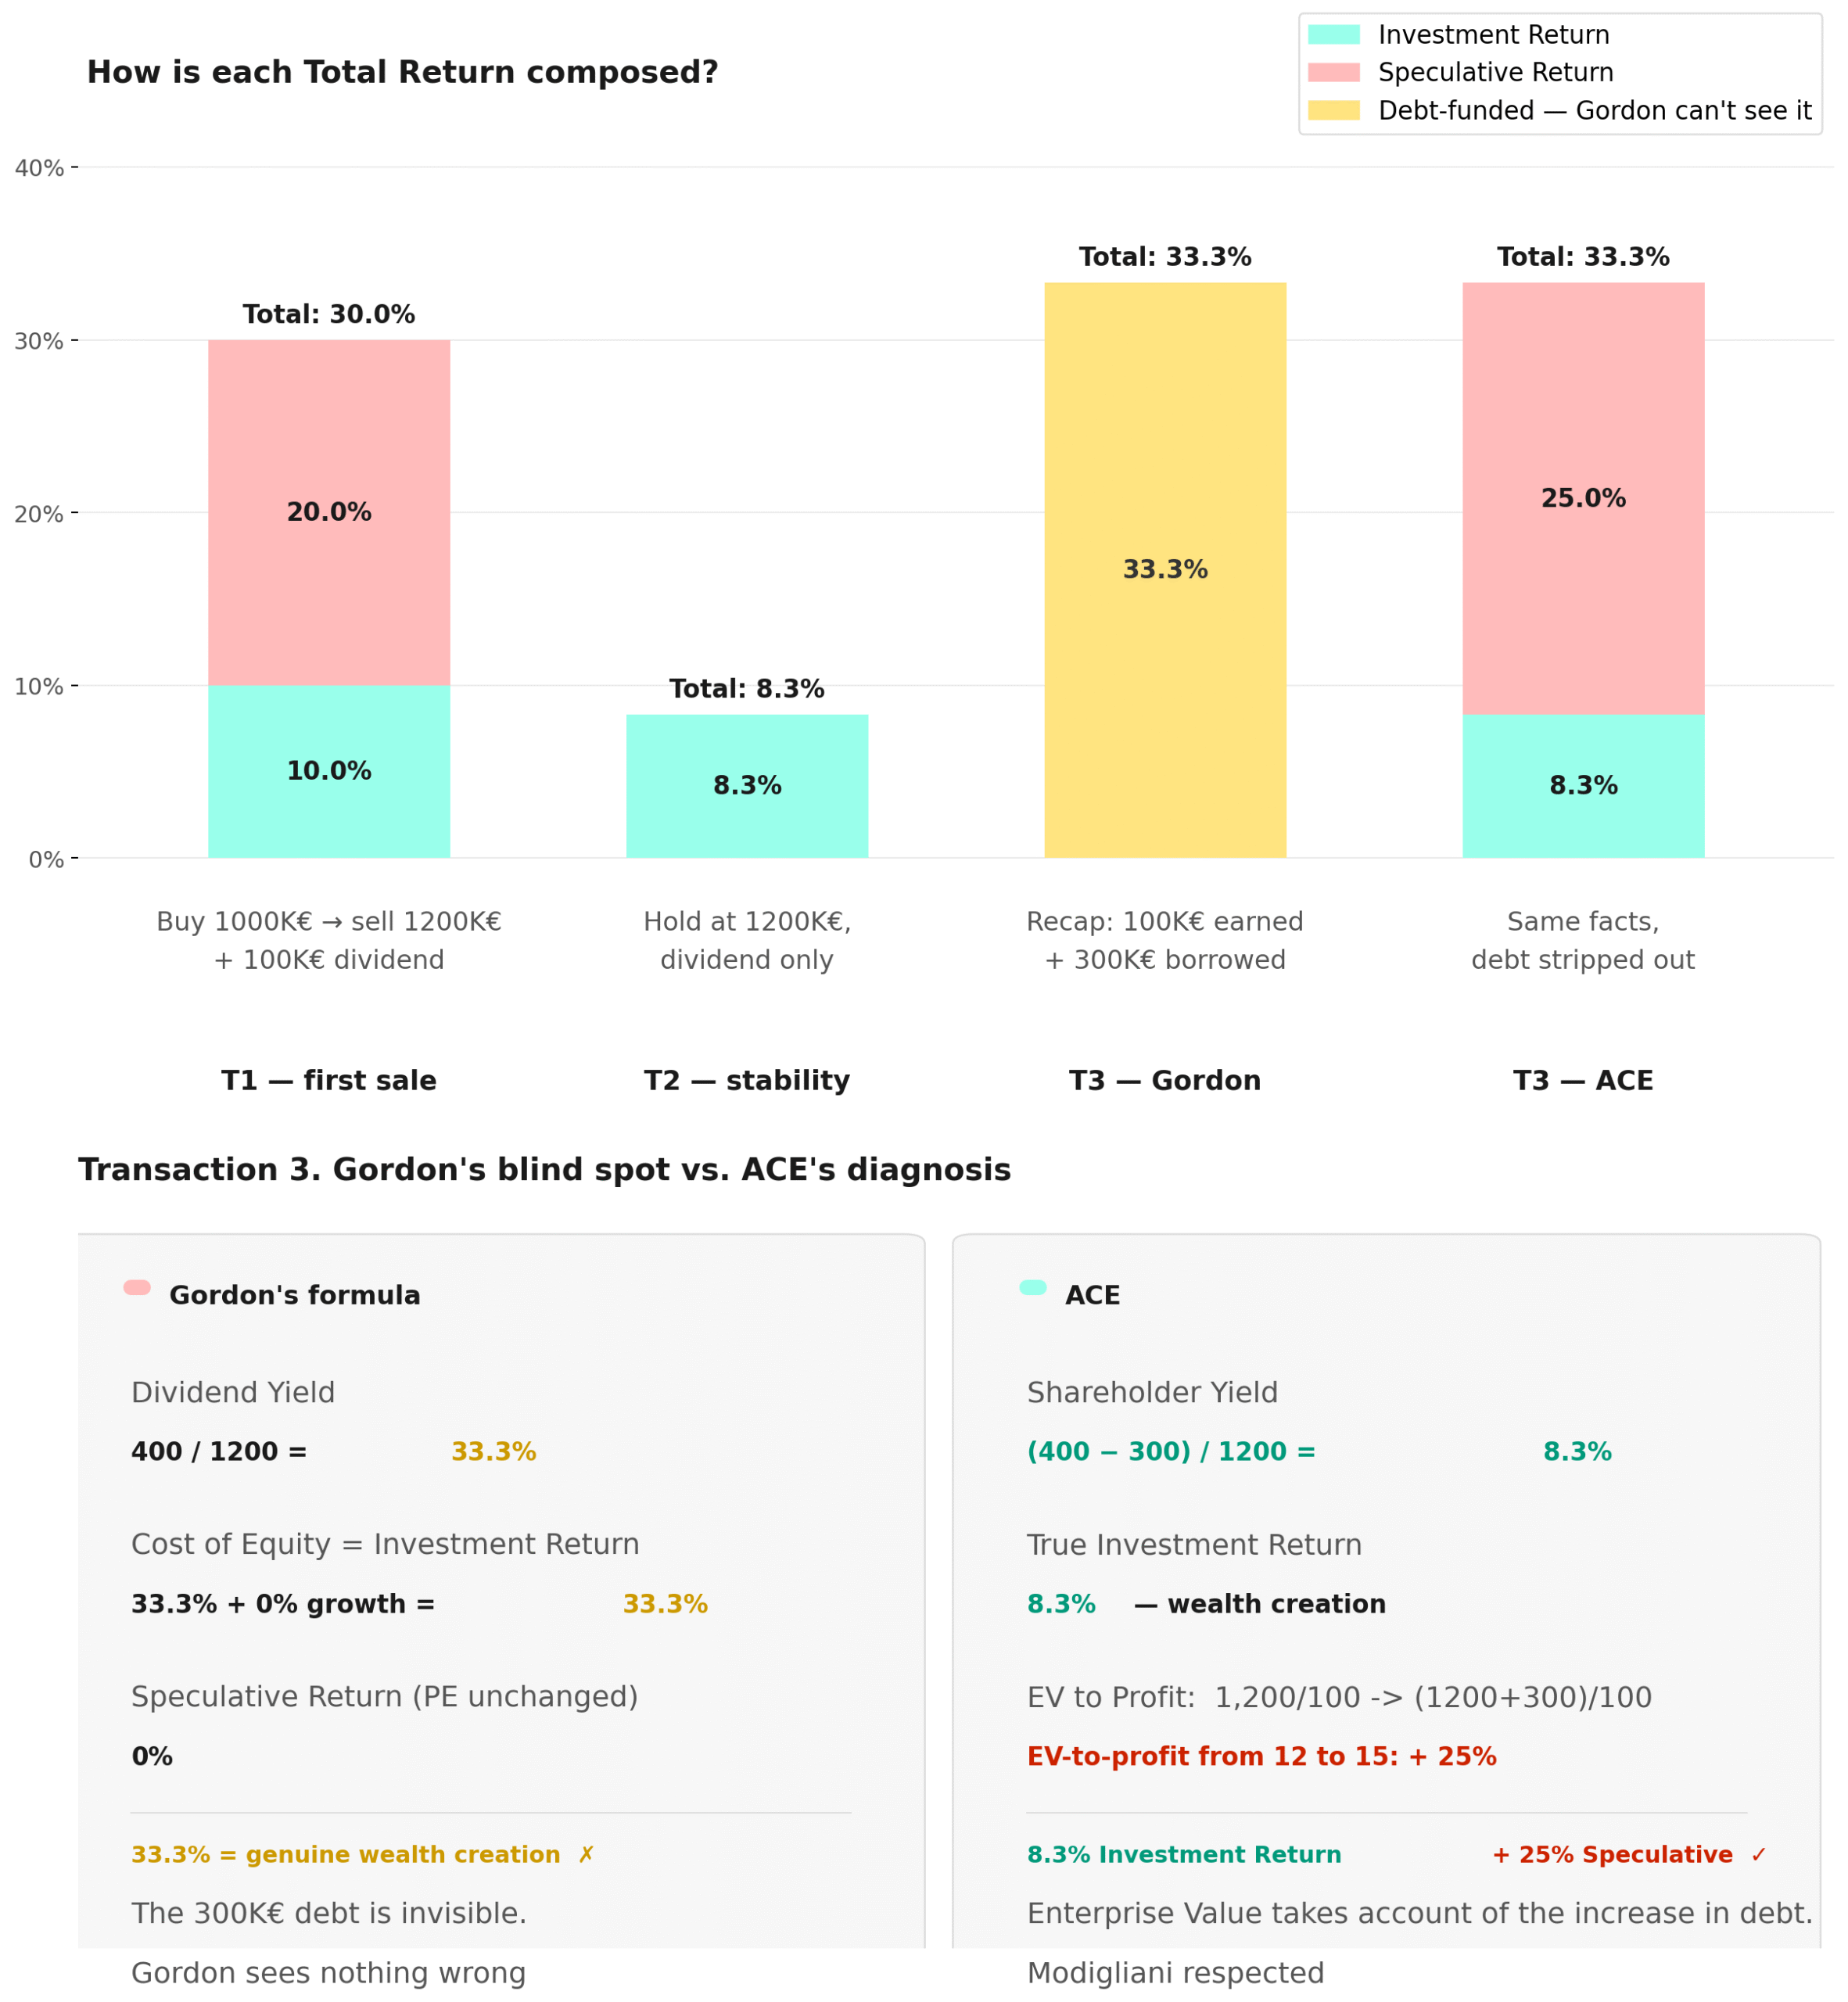
The following year, he sells the bakery to a second owner for 1200 K€.
His one-year performance is 30%: 100 K€ in dividends and 200 K€ in capital gain, on an initial investment of 1000 K€.
The PE, moving from 10 to 12 (1200 K€ / 100 K€), rose by 20%.
Formula ③ in page ACE (The standard Gordon-Shapiro formula section) neatly explains the performance:
In Bogle’s language — which we have adopted — these 30% of Total Return are properly split into 10% of Investment Return and 20% of Speculative Return.
Transaction 2: Stability
The second owner paid 1200 K€, so his investment has an intrinsic return of 8.33%:
The following year, he does nothing but collect his dividend. The bakery market stays at a PE of 12; his bakery is still worth 1200 K€ → his Speculative Return is zero.
Performance equals the 8.33% Investment Return (8.33% = 100 K€ / 1200 K€ invested) ✓
Transaction 3: The dividend recap
The year after, having learned about the “dividend recap” technique from his son-in-law who works in a Private Equity group, he has the bakery borrow 300 K€ on 30 December. Combined with the 100 K€ earnings for the year, he pays himself a super-dividend of 400 K€ on 31 December.
The next day, 1 January, he sells the bakery to a third owner for 1200 K€ — his original purchase price.
The new buyer has only one compass for valuing a business: the PE ratio. A neighbouring bakery recently changed hands at a PE of 12, so he is satisfied with the transaction.
Question: Wealth Creation or Speculation?
To what extent are the 400 K€ gained by the seller due to the bakery’s intrinsic profitability — and to what extent are they speculative?
Before answering, consider the buyer: he could have purchased another debt-free bakery for 1200 K€. Following common sense (and Modigliani), he should not have paid more than 900 K€ = 1200 K€ − 300 K€ of debt. He therefore faces a potential loss of 300 K€, which he will realise the day he tries to resell — unless he finds someone as gullible as himself.
From the seller’s perspective, the mirror image is clear: his gain is equivalent to a capital gain with nothing to do with the bakery’s wealth creation. It is purely speculative.
Analysis with Gordon
The seller’s gain is 400K€: the super-dividend of 400K€ (= 100K€ from earnings + 300K€ borrowed) plus zero capital loss from selling at 1200K€. Performance = 400K€ / 1200K€ = 33%.
Gordon’s formula — and the PE — see nothing wrong here:
- Dividend Yield = 400 / 1200 = 33%
- Cost of Equity = 33% + 0% (no earnings growth)
- PE performance = Speculative Return = 0%
- Formula ③ in page ACE (The standard Gordon-Shapiro formula section) checks out: 33% = 33% + 0%, with zero Speculative Return
Something is clearly wrong with the PE and Gordon’s performance analysis, since we cannot accept that these 33% represent genuine wealth creation by the bakery.
The moral of the story
This example shows that it matters greatly to know whether distributions stem from borrowing or from self-financing through earnings.
The same question is even more pressing about growth: does it come from self-financing or borrowing?
The PE is blind to these questions — and so is Gordon’s model.
The ATOS case (see ACE ATOS) — a company that borrowed massively until 2019 without matching earnings growth — illustrates the risk of excessive debt.
Growth through debt is not necessarily bad, but it calls for indicators that are not distorted when debt changes.
Conclusion
ACE naturally integrates debt and cash through Enterprise Value, thereby respecting the Modigliani principles that standard Gordon ignores.
ACE replaces Dividend Yield with Shareholder Yield:
In Transaction 3, when the second owner paid himself a super-dividend by borrowing, ACE subtracts the 300K€ debt increase from the 400K€ dividend — correctly recovering the 100K€ actually generated by the bakery’s activity.
ACE keeps the elegance of Gordon — and adds Modigliani.