Groundbreaking metrics for equity profitability
Asset Allocation and Equities
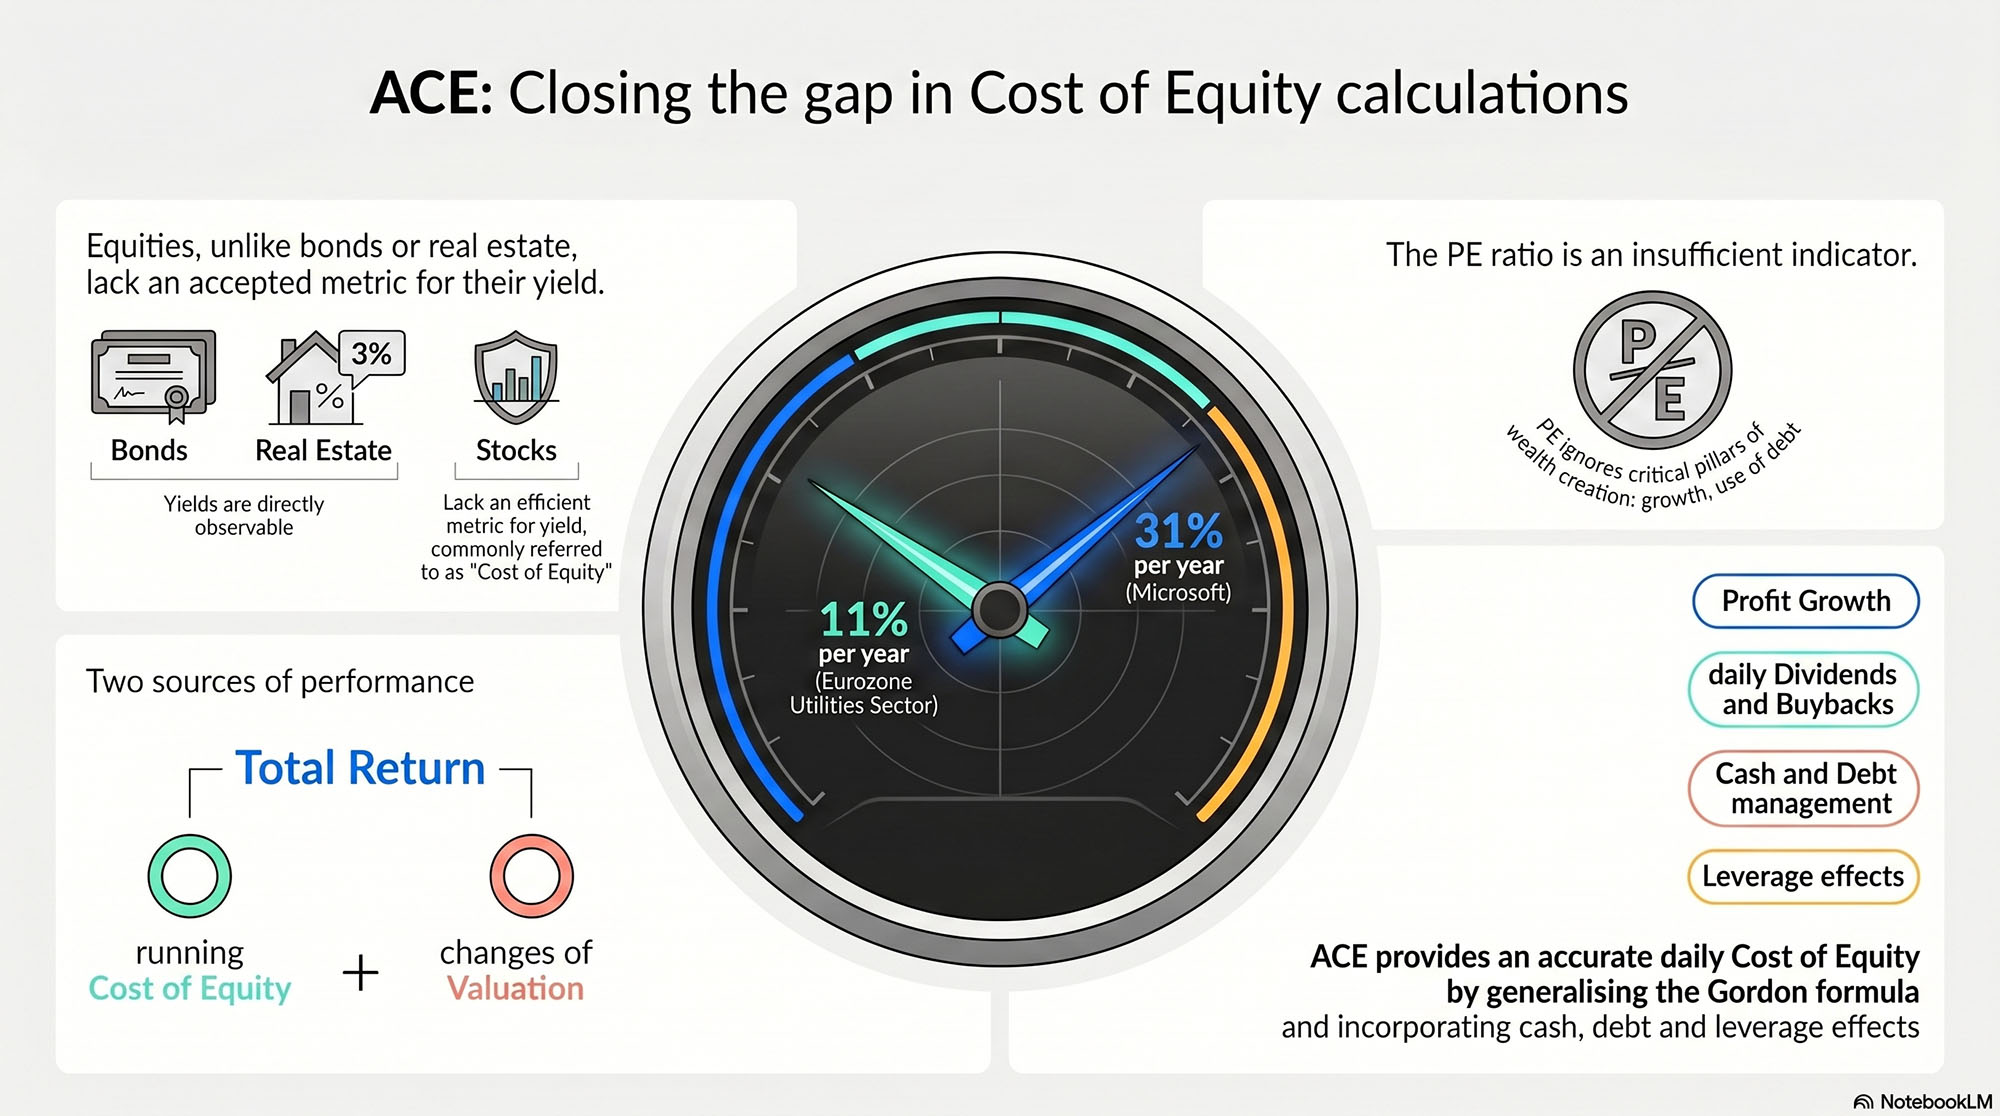
For investors, portfolio managers and advisors, equities generate more uncertainty than other asset classes – bonds or real estate – because of two very difficult questions:
Are equities overpriced?
- Dozens of valuation ratios and multiples sometimes give divergent signals: the Price Earnings ratio (PE), Price to Book (market value / book value), Enterprise Value / Profit, etc.
- The PE ratio enjoys widespread favour despite its serious shortcomings: by construction, it ignores two pillars of wealth creation – growth and use of debt.
How much do equities yield?
-
Profitability indicators are fragmented: dividend yield, Earnings Yield, earnings growth, CAPM… and none of them can claim to say, “this is what equities yield.”
-
Rather than seeking a profitability intrinsic to the company’s activity and its assets, the share price, professionals produce 1-year or 10-year performance forecasts anchored to anticipated PE ratio… with unconvincing results. Illustration. For decades, 10-year US equity performance expectations from institutional investor (source NASRA) surveys have systematically underestimated realised returns: around 7%, while the S&P 500 has posted average decennial returns well above 10% per annum during these decades.
-
Nobody ever publishes “the S&P 500 yields 12% per year” or “the CAC 40 is an asset that, as of today, yields 8%.”
Why? Because the profitability of equities, known as the Cost of Equity, is deemed “not directly observable”, and the proxies are not satisfactory enough.
There are approximate models, such as the CAPM based on historical performance statistics, or the overly simplistic Gordon formula¹.
PRODIG’s ACE is a generalisation of Gordon’s formula, moving from an annual view to a daily calculation and incorporating debt and cash – a rigorous mathematical and algorithmic framework that constructs the intrinsic profitability of equities on a daily basis.
¹ Gordon’s formula gives a Cost of Equity, or “discount rate”, equal to Dividend Yield + Growth. See explanations in the ACE page.
Example of Cost of Equity with ACE
Shown below are the ACE Cost of Equity figures, from Feb 2016 to end of February 2026, for two very different assets:
- Microsoft’s share
- The Euro-zone Utilities sector
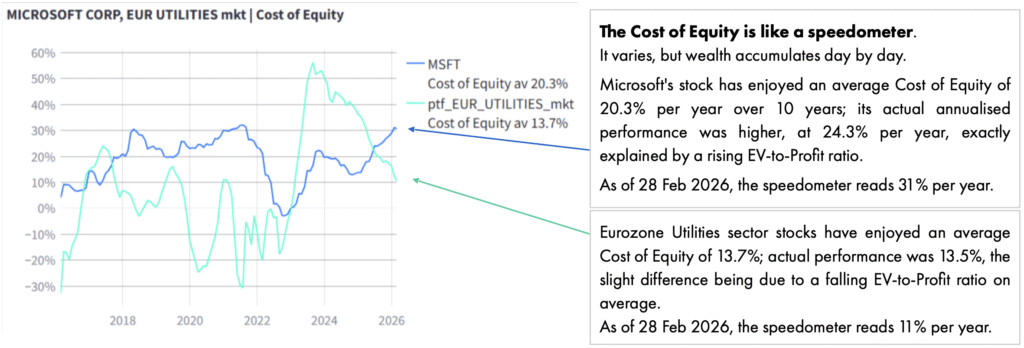
In this example, the Cost of Equity figures as of 28 February 2026 indicate that Microsoft “yields” 31% per year, and the Euro Utilities sector 11%.
Note. The Cost of Equity can occasionally turn negative, notably when earnings growth is negative.
ACE is a tool indifferent to the type of equity – whether Growth or Value.
The market is obsessed by the valuation level of stocks, principally the PE ratio, and trying to anticipate its changes.
But the main reason for Microsoft’s long-term outperformance is its superior Cost of Equity, which ACE makes observable on a daily basis.
The ACE Principle
A.C.E. means Analyse en Composantes Exactes (Exact Component Analysis).
Any performance can be broken down into two terms, following this universal principle:
“There are only two sources of wealth creation with any asset: it yields; it appreciates”
-
Real estate: net rental income + change in price per m²
-
Bonds: yield to maturity + effect of the change in yield
-
Equities with ACE: Cost of Equity + effect of the change in the EV-to-Profit ratio
Mathematically, this is expressed each day as:
\text{daily performance} = \text{Cost of Equity} / 365 + \text{effect of EV-to-Profit variation}
ACE derives the Cost of Equity by generalising Gordon’s formula, moving from an annual view to a daily calculation, and incorporating the leverage effect (use of debt).
The daily Cost of Equity computed by ACE also equals the annualised performance of the share if the EV-to-Profit ratio remains identical to the previous day’s.
² EV-to-Profit = Enterprise Value / Profit
with Enterprise Value = Market Value + Debt – Cash
and Profit = Earnings estimates + Interest
What Changes with ACE
-
Consistency: a unique (profitability, valuation) pair, replacing dozens of disparate indicators. Performance stems from the running Cost of Equity and the effect of EV-to-Profit ratio changes, and nothing else.
-
Daily calculation: all series are daily, including accounting figures that are originally quarterly or annual. Every day we have an exact split of performance:
\begin{aligned} \text{daily Total Return} &= \text{Cost of Equity}/365 + \text{effect of EV-to-Profit variation} \\ &= \text{daily Investment Return} + \text{daily Speculative Return} \end{aligned}
\text{daily Total Return}=\frac{\text{Cost of Equity}}{365}+\text{effect of EV-to-Profit variation}
=\text{daily Investment Return}+\text{daily Speculative Return}
Universality: the indicators work the same way for both “Growth” and “Value” style equities.
Debt considered: where Gordon’s formula is misled by the use of debt to distribute dividends or to fund growth, ACE naturally incorporates debt and cash via Enterprise Value (Market Value + Debt – Cash) and shareholder yield.
Proper treatment of shareholder distributions: dividend payments do not enrich the shareholder, since the company’s cash falls by the same amount; ACE produces and uses Shareholder Yield, tracking cash moves and changes of debt that actually count for the shareholder:
Dividends + Buybacks – Cash decrease + Debt reduction, relative to price and annualised.
Performance: simple backtests using ACE’s Cost of Equity and Enterprise Value to Profit consistently outperform equivalent classical approaches (Gordon’s formula and the PE ratio).
Detection of major buy opportunities: more effective than Gordon and PE at spotting « big fish » – stocks with an ultra-high Cost of Equity and not so richly valued by their EV-to-Profit, such as US tech since 2014.
Detection of major sell opportunities: significantly more effective at identifying distressed companies caught in the « value trap », with negative Cost of Equity while Gordon’s remains positive, and where a low PE is fallacious, concealing excessive debt relative to market value.
See the page ACE.
An Innovation Born from the Field
ACE was developed by practitioners who felt this gap most acutely while managing diversified funds, drawing on a solid Fixed Income foundation. ACE provides a coherent, operational answer to the question of the intrinsic profitability of equities.
There are no statistics in ACE. It is a logical extension of Fixed Income, generalising Gordon’s formula while respecting Modigliani’s principles.
For an accurate and rigorous measure of equity profitability,
discover the ACE Dashboards: Offers

Arnaud Motte
PRODIG is led by a team of experienced financial market professionals who have extensive sell-side and buy-side expertise, including in market making, arbitrage, research, and UCITS management.
Arnaud Motte, the company’s founder, worked in applied mathematics before spending 35 years in the financial markets. Throughout his career, he has sought to combine research with operational activities, such as automating market making in government debt in his early years, and allocating assets across diversified funds.
During the final three years of his career as a fund manager, his flagship fund, AIM Réactif, received a 5-star rating from Morningstar. Having worked as a fixed income researcher at an asset management firm specialising in risk premia, he founded PRODIG in 2021 with the primary objective of tackling the Cost of Equity conundrum.
Test formule
Many research articles choose X=Earnings.
As the ratio \frac{P}{E} is noted PE, we get:
perf=\left(\frac{Div}{P}+g_E\right)+\frac{\Delta PE}{PE}\cdot(1+g_E)
with:
\frac{Div}{P}+g_E: Income Yield or Investment Yield
\frac{\Delta PE}{PE}: Change of valuation (performance of the ratio)
We have generalize this Gordon™ formula to take into account share buybacks or issuances, debt reduction or increase, etc.:
perf=R_X+k\cdot\frac{\Delta EVtoX}{EVtoX}
Where:
R_X is the Cost of Equity, including the total shareholder yield and the growth of X
k includes the leverage
EVtoX is the ratio Enterprise Value to X