The Cost of Equity: An Ancient Quest
For several decades, finance professionals and professors have been trying to quantify the intrinsic rate of profitability of a stock, known as the Cost of Equity.
Here are some important milestones:
The original Gordon-Shapiro formula (1956)
Gordon and Shapiro laid the groundwork by establishing a link between the cost of equity and dividend yield plus growth:
This simple yet powerful formula remains a meaningful reference point. It rejects the false notion of common sense that a stock’s profitability is equal to its earnings divided by its price, which is true only in some cases, such as when there is no growth.
However, the original Gordon model is limited to an unrealistic world in which future dividends are known and growth is assumed to be constant. In reality, future dividends are unpredictable. For this reason, the Cost of Equity is often considered unobservable.
wikipedia Cost_of_equity
The standard Gordon-Shapiro formula
Gordon’s formula has been adapted with earnings growth:
\text{Cost of Equity} = \text{Dividend Yield} + \text{Earnings growth rate} ①
In this case, it is sufficient to consider the anticipated dividend and earnings over the next year without making any long-term assumptions.
Demonstration.
The demonstration of ① can be done without mathematics, by reasoning over one year: just as
GDP growth equals population growth + GDP per capita growth,
Price growth equals Earnings growth + Price/Earnings ratio growth.
The Price Earnings ratio is noted PE. People say « price performance » rather than « price growth » because the price fluctuates. Hence the gain with the price for the shareholder:
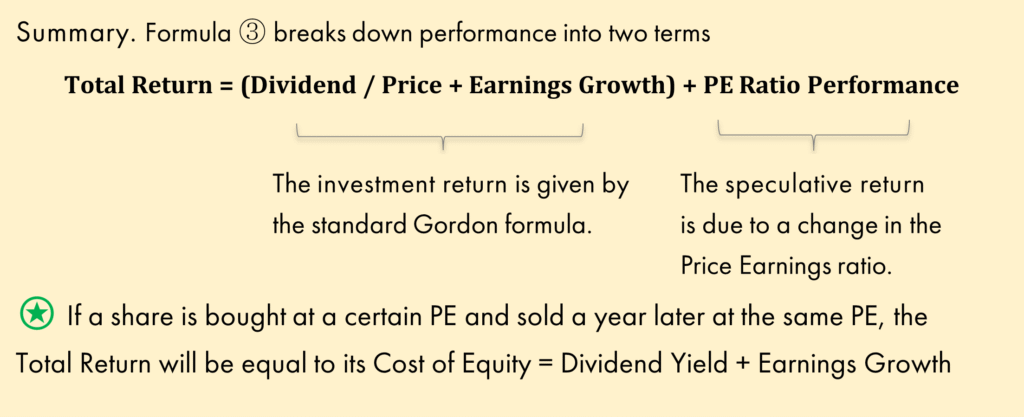
We calculate the “total return” by adding dividend income to price performance:
In this formula:
the left component is the Cost of Equity according to Gordon ①,
and the right component captures the fluctuations of the Price Earnings ratio.
Jack Bogle, the founding father of ETFs, used this formula as the key to understanding stock performance. He employed two terms that we adopted:
Investment Return = performance resulting from asset’s intrinsic profitability
Speculative Return = performance resulting from valuation changes
The Modigliani-Miller principles (1958)
Modigliani-Miller’s work showed that the meaningful measure of money invested in a company is:
Only Enterprise Value matters, not how it is allocated between Market Value and Debt. Modigliani’s principle is simple: buying a company with no debt at a price of X is equivalent to paying X – D if the company has debt D.
He also emphasised that, for shareholders, dividends are meaningless, if only because keeping the money in the company’s account is essentially the same as transferring it to them.
These principles are straightforward, yet markets often overlook them.
As we will see, both Gordon’s formula and the Price Earnings metric are blind to Modigliani’s principles.
The CAPM (1960s)
The CAPM (Capital Asset Pricing Model) brought theoretical elegance by linking the Cost of Equity to security risk and market risk. Mathematically appealing, it has nevertheless shown its empirical limitations: for decades, the CAPM has produced higher Costs of Equity in Europe than in the United States, a discrepancy that has been evident in realized performance for too long.
Why Go Further?
We could be satisfied with formula ③ to answer the two major questions:
Is the stock expensive? What is its intrinsic profitability?
Indeed, PE ratio is the most used metric for judging a stock’s value, and the Gordon standard provides an answer to the second question.
However, Gordon’s formula and the Price Earnings ratio (PE) overlook the use of debt and cash management for growth and for distributing cash to shareholders through dividends or buybacks.
The Amazon example: when Gordon is fine
Let’s take Amazon to illustrate a case where the analysis with Gordon works well, with a period at unchanged Price Earnings ratio (PE).
-
At the end of December 2025 Amazon’s PE equals 28.5, the same value as at the end of August 2004
-
Earnings per share were multiplied by 121 during the period (annual growth 25.2%)
-
Formula ③ says that the annual price performance should equal 25.2%, since the PE is unchanged. This is verified with the price, also multiplied by 121
-
Amazon never distributes dividends, so total performance is that of the price.
Total performance: $100 invested on August 31, 2004 became $12,100 at the end of 2025
In Amazon’s case, standard Gordon gives a satisfactory intrinsic rate of profitability, or Cost of Equity: 25.2% during these 21 years.
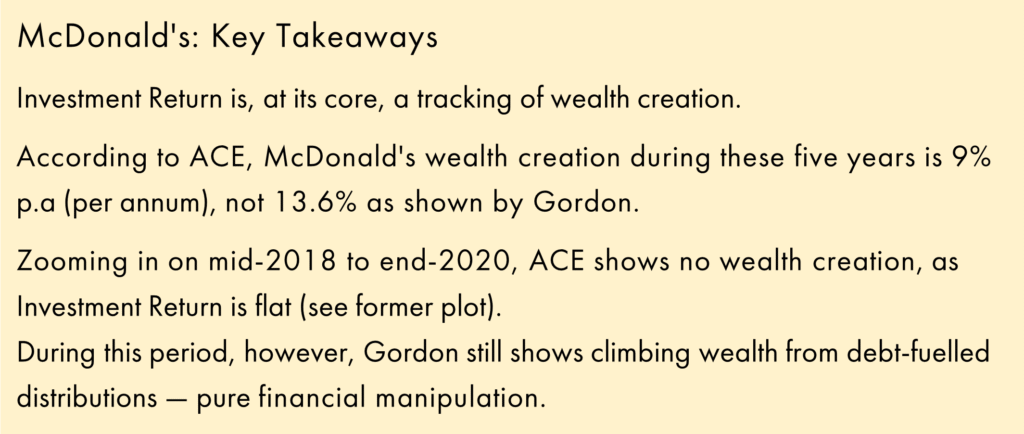
The McDonald example: when Gordon can mislead us
McDonald made enormous distributions during five years starting in 2015, largely financed by Debt issuance:
-
From January 1, 2015, to December 31, 2019: McDonald distributed $44bn in the form of $16bn in dividends and $28bn in buybacks, while total Earnings were only $27bn
-
Net Debt went from $19bn to $55bn
-
So much cash was paid out that the Book Value, i.e. the equity’s accounting valuation, became negative, going from $12bn to -$8bn!
-
McDonald’s Earnings have grown by an average of 3.9% per year. However, Earnings per Share have grown by an average of 9.3% per year, optically inflated by share buybacks.
Buybacks are controversial. Imagine that shareholders are a family. Dividends are distributed to all family members, but when there are buybacks or capital issuances, only the willing cousins participate. Like dividends, buybacks are cash that goes to the shareholder family accounts and leaves the company’s account.
Gordon’s formula, which adds dividend distribution to earnings per share growth (9.3%), gives an average Cost of Equity of 13.6%.
(As an alternative approach, we can take McDonald’s earnings growth of 3.9% and add the distribution rate, which includes dividends and buybacks, to find the same 13.6%.)
McDonald’s had to borrow the difference to distribute $44 billion in five years after making $27 billion in earnings.
Common sense tells us that when a company borrows to distribute dividends or buybacks, shareholders are not enriched. Gordon’s formula ignores debt usage, treating distributed dividends and earnings growth as « earned money ». In McDonald’s case, the 13.6% annual figure is optically inflated, as borrowed money must eventually be repaid.
Now let’s introduce ACE, which will be explained in more detail later, and compare three curves:
-
The Total Return index
-
The Investment Return index according to Gordon: compounding of Dividends and Profit Growth (ref. summary of § 1)
-
The Investment Return index according to ACE
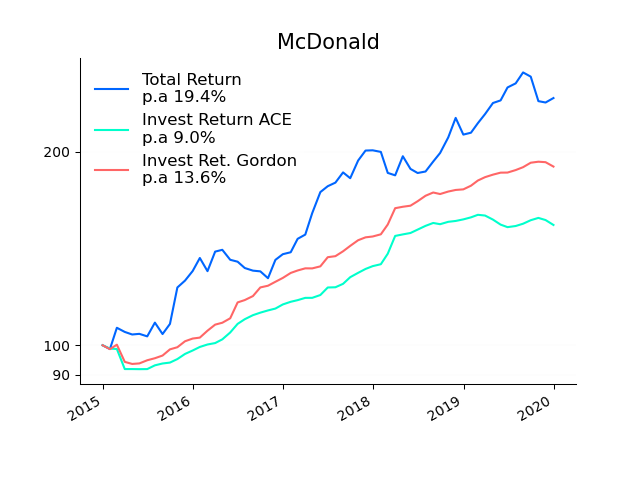
Over the last two years,
Invest. Return Gordon keeps
climbing, inflated by debt-fuelled
distribution.
But in reality, over these last two years,
Invest. Return ACE is flat
⇔ Cost of Equity ACE = 0%
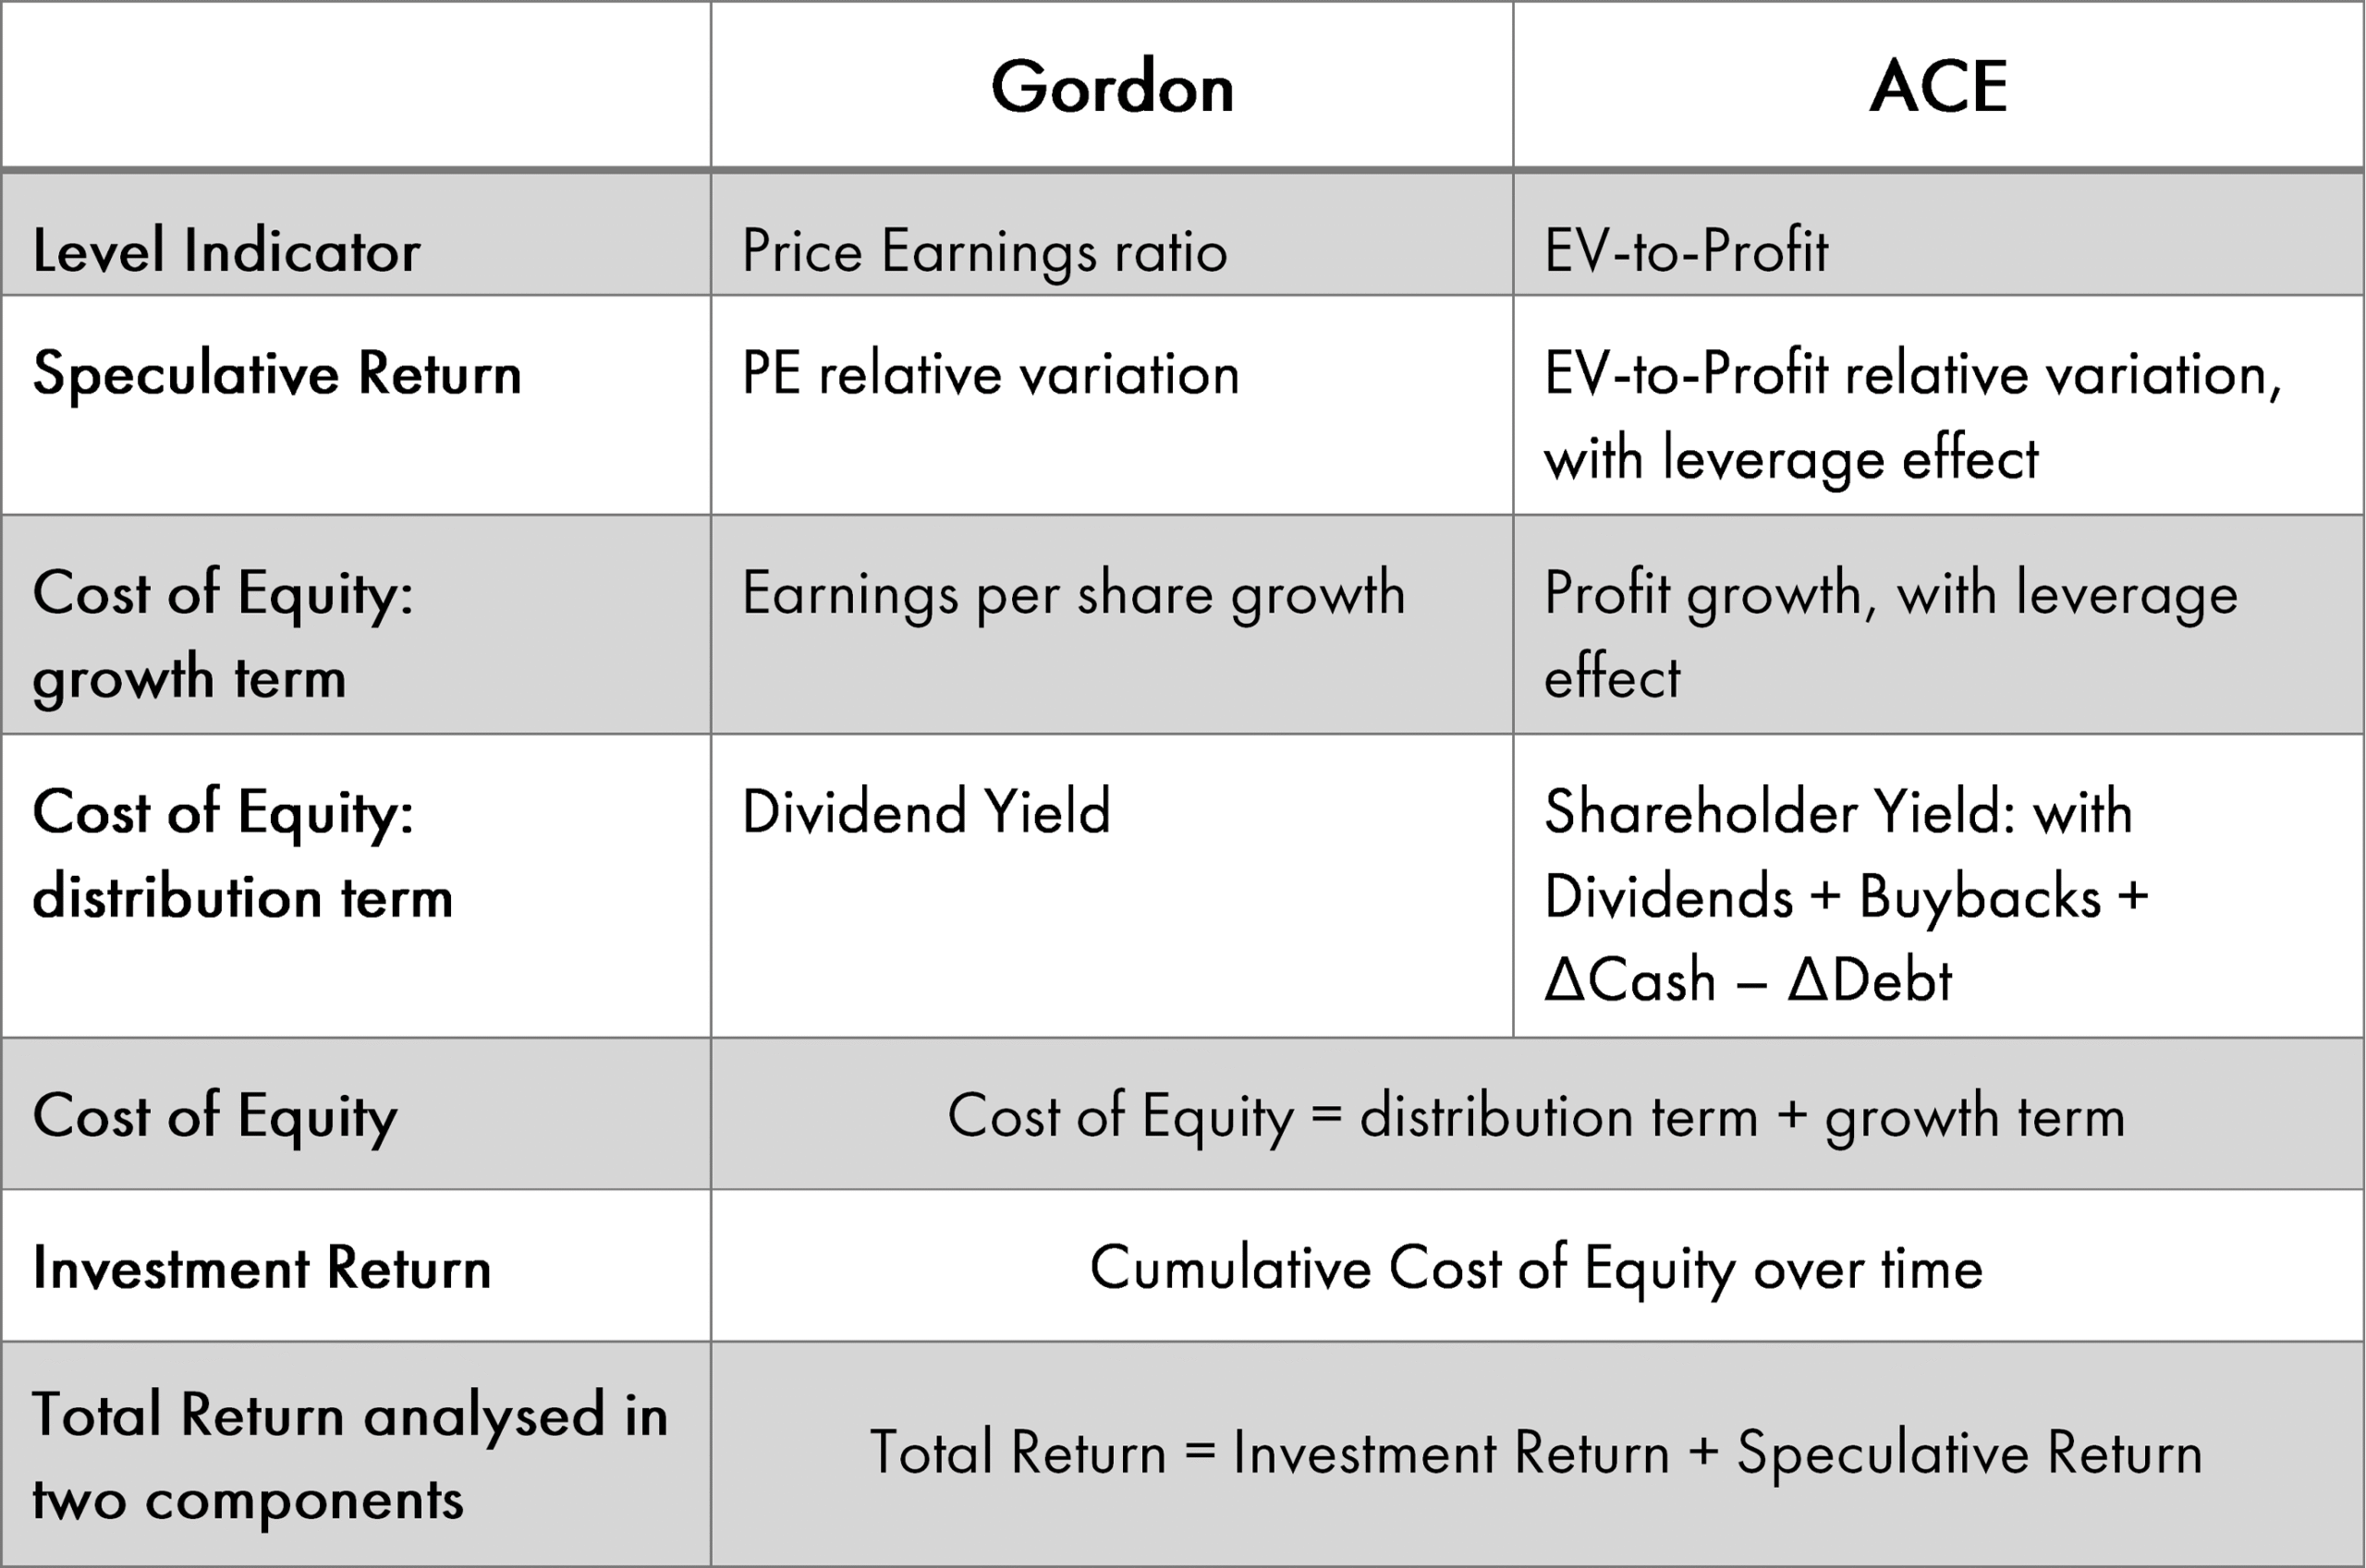
ACE accounts for debt and cash variations. Instead of Dividend Yield, it uses Shareholder Yield: Dividends + Buybacks (net of issuances) + ΔCash – ΔDebt, relative to price and annualized.
When a company borrows to distribute, Shareholder Yield and ACE’s Cost of Equity remain unchanged.
Comparison of Gordon and ACE
ACE is based on the standard Gordon model but adheres to Modigliani’s principles.
Rather than limiting itself to analysing share performance, it starts from analysing enterprise value performance, enterprise value being equal to the total of the shares value and net debt.
Instead of PE, the valuation indicator becomes the EV-to-Profit ratio, where EV is Enterprise Value and Profit is the sum of Earnings and Interest.
Enterprise Value = Market Value + (Debt – Cash)
Profit = Earnings + Interest
EV-to-Profit = Enterprise Value / Profit
Changes between Gordon and ACE
ACE and Gordon, in the ATOS example
ATOS is a textbook case of growth through debt.
ATOS is a French IT services company that experienced a spectacular trajectory from 2015 by resorting to massive borrowing until 2018, then a collapse in 2022-2023.
The ATOS example is treated exhaustively in the Case Study – ATOS page. We position ourselves just after the publication of accounts in February 2021, starting six years earlier.
- ATOS acquires Syntel in July 2018 by financing the acquisition through debt
- Debt went from €4.5 billion (bn€) in June 2018 to €9bn at the end of 2018
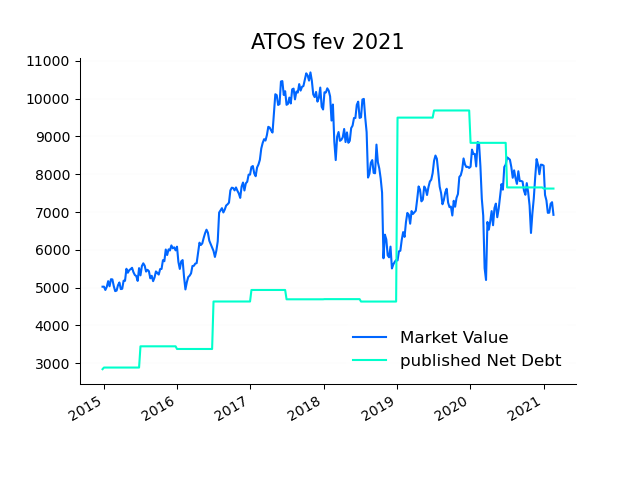
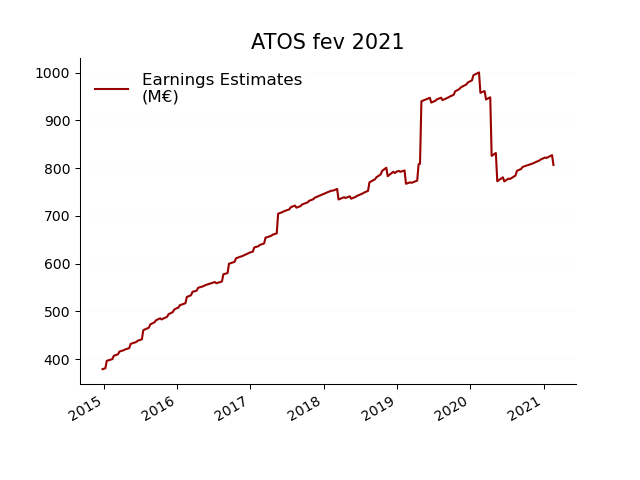
Anticipated earnings (Earnings Estimates) remained on an upward trend overall, despite the sharp revision spike and correction in 2020.
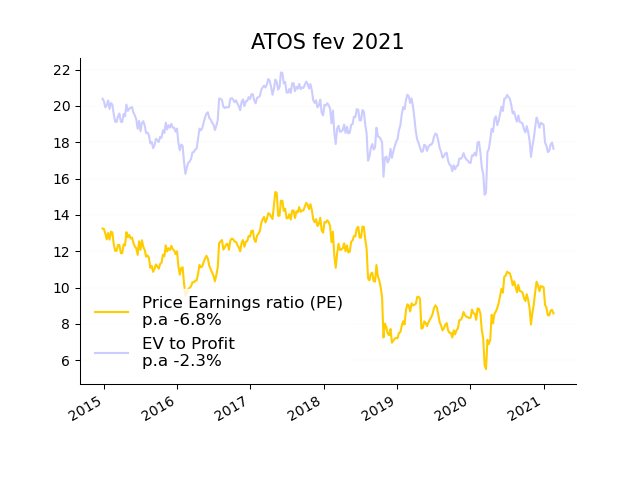
The PE went from 13 in early 2015 to 8.6 in February 2021. At this PE level, the ATOS stock becomes a « Value » stock. Is it attractive nonetheless?
As with McDonald, let’s compare three curves: Total Return, Investment Return according to Gordon, and Investment Return according to ACE.
The graph that says it all
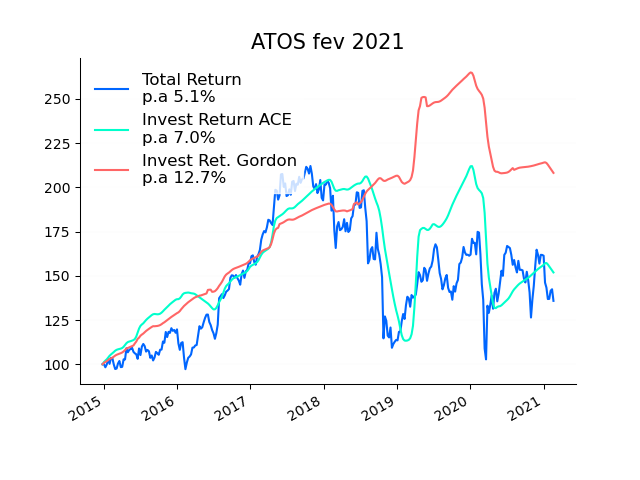

Like the famous Coyote, Invest. Return Gordon stays high, even after the 2020 Earnings Estimates downward revision.
Invest. Return ACE
is much more revealing and accurate. Wealth creation has been on a downward trend since mid-2018
⇔ average negative Cost of Equity
Syntel acquisition was announced on the 22nd of July, 2018. Total Return is down 30% from July 2018 to February 2021. The market does not appreciate the Syntel operation.
(Remember that the calculations are made with data published in February 2021)
Divergent signals
According to Gordon and the PE ratio:
• ATOS creates wealth (+12.7% per year)
• The underperformance comes from the PE drop (speculation). With a PE equal to 8.8, ATOS has become a « Value » opportunity
According to ACE and Enterprise Value to Profit ratio:
• ACE Cost of Equity detects that wealth creation is broken in mid-2018, with the announcement of the Syntel acquisition.
• The EV-to-Profit ratio varies little, taking into account the rise in debt. According to the EV-to-profit ratio (=18), ATOS remains at a good valuation level in February 2021
A manager using ACE would have been much more tempted to exit in early 2021.
A manager selling at this level in February 2021 is not ‘cutting’ on a low PE; he is giving up on a stock whose wealth creation has become negative, and selling it at an EV to Profit ratio of 18 — which is fair enough.
History has shown it was the right decision: the stock lost 98% afterward.
ACE and Gordon, in the French Real Estate
Let us end on a positive note, with a sector swimming against the tide: the Paris-listed Real Estate sector.
We examine the five companies that were included in the Stoxx600 index ten years ago: Unibail-Rodamco-Westfield (the only one in the CAC40); Klépierre, Gecina and Covivio (formerly Foncière des Régions); and Icade (removed from the Stoxx600 in 2024).
ACE calculations can easily be combined to obtain them at portfolio level.
The period studied is from February 2016 to February 2026.
This set of stocks has low profit growth and challenging prospects, with the future leaning towards AI rather than offices or shopping centres.
Nevertheless, it may still offer attractive returns, as its companies trade at a discount, which is typical of value-style stocks.
Let us take a look.
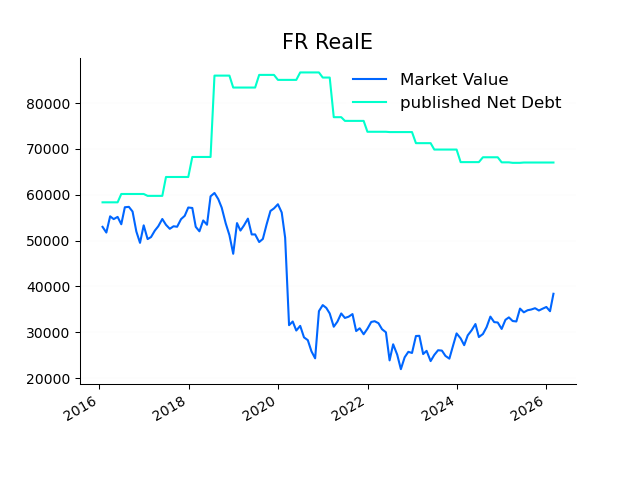
Debt plays a central role in this business. Debt movements can reach tens of billions of euros, which is on a par with the Market Value itself.
The sector has never fully recovered from the Covid shock
Yet it managed to reduce its debt load, with net Debt (Debt minus Cash) falling from €85bn to €68bn, without sacrificing earnings indefinitely:
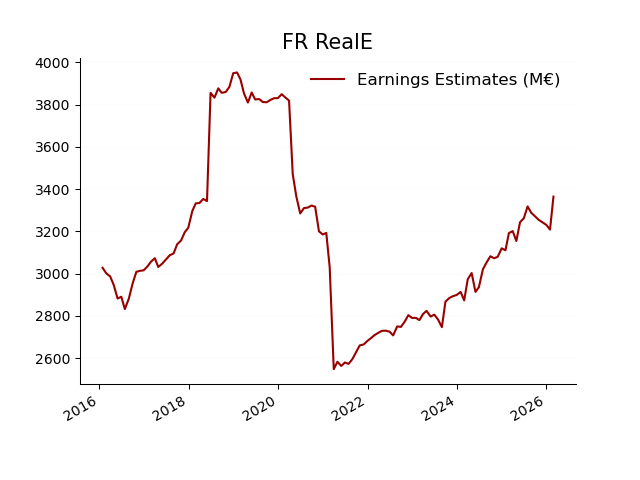
Anticipated earnings (Earnings Estimates) have been rebounding since 2021
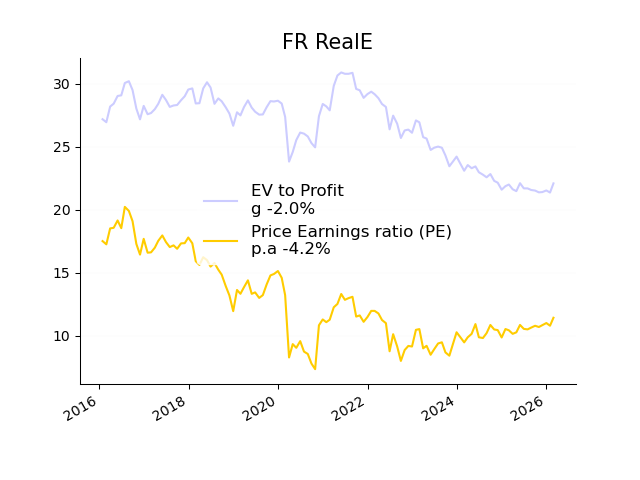
The PE ratio has fallen sharply over the decade, by one third. A PE ratio of 10 places the sector firmly in ‘value’ territory.
However, the EV to Profit ratio tells a different story. It has fallen from 27 to 22 — only an 18% loss. The downside is:
22 does not represent a discount; in fact, the sector was overvalued before the pandemic.
Another graph that says it all
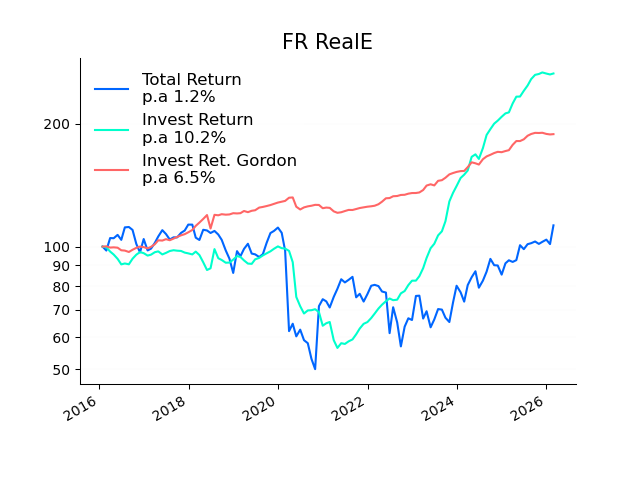
The Gordon Investment Return curve (cumulative Dividend Yield + Earnings Growth) is blind to the surge in debt through 2020 and its subsequent decline from 2021 — both of which had an enormous impact on shareholder wealth.
It projects a false smoothness, particularly in light of the severe shocks the sector absorbed.
ACE, on the other hand, signals that from 2016 to 2021 the sector had been spinning its wheels (the green curve is flat): growth and dividend distributions were being funded entirely by debt.
Since 2022, ACE has been reversing its signal: debt reduction combined with a return to earnings growth — amplified by the leverage effect — produces a very attractive Investment Return.
The last reading of Cost of Equity is 0%, as we see the recent flatness in 2026. But if the Cost of Equity succeeds in staying as high as it was in 2022-2025, the lost decade of this “has been” sector might be followed by juicy years.
CONCLUSION. What ACE brings
Without making predictions, and accepting Earnings Estimates as they are given by the consensus, ACE provides investors with more relevant metrics:
It has the simplicity of Gordon’s formula principle while taking into account cash and debt,
It is designed for daily calculation in daily series,
ACE’s Cost of Equity is a significantly better signal of future performance than that given by Gordon’s formula, as demonstrated by simple backtests,
ACE’s Cost of Equity delivers a meaningful and refined measure of the intrinsic profitability of stocks.
The previous examples have shown how ACE integrates growth, dividends, buybacks, cash management, debt and leverage into a single Cost of Equity — a meaningful and accurate measure of the yield an investor can expect from holding a stock.
Let us finish with a French anagram:
« Les données pertinentes
détiennent les réponses. »
(Relevant data hold the answers)